Plot the result of the pnorm function. The syntax is the same as the pnorm function.
Usage
ggnorm(q = NULL, mean = 0, sd = 1, lower.tail = TRUE, within = TRUE)
Arguments
- q
numeric; The quantile to evaluate the pnorm
- mean
numeric; The mean of the normal distribution
- sd
numeric; The standard deviation of the normal distribution
- lower.tail
logical; if TRUE (default), probabilities are \(P[X \le x]\) otherwise, \(P[X > x]\).
Examples
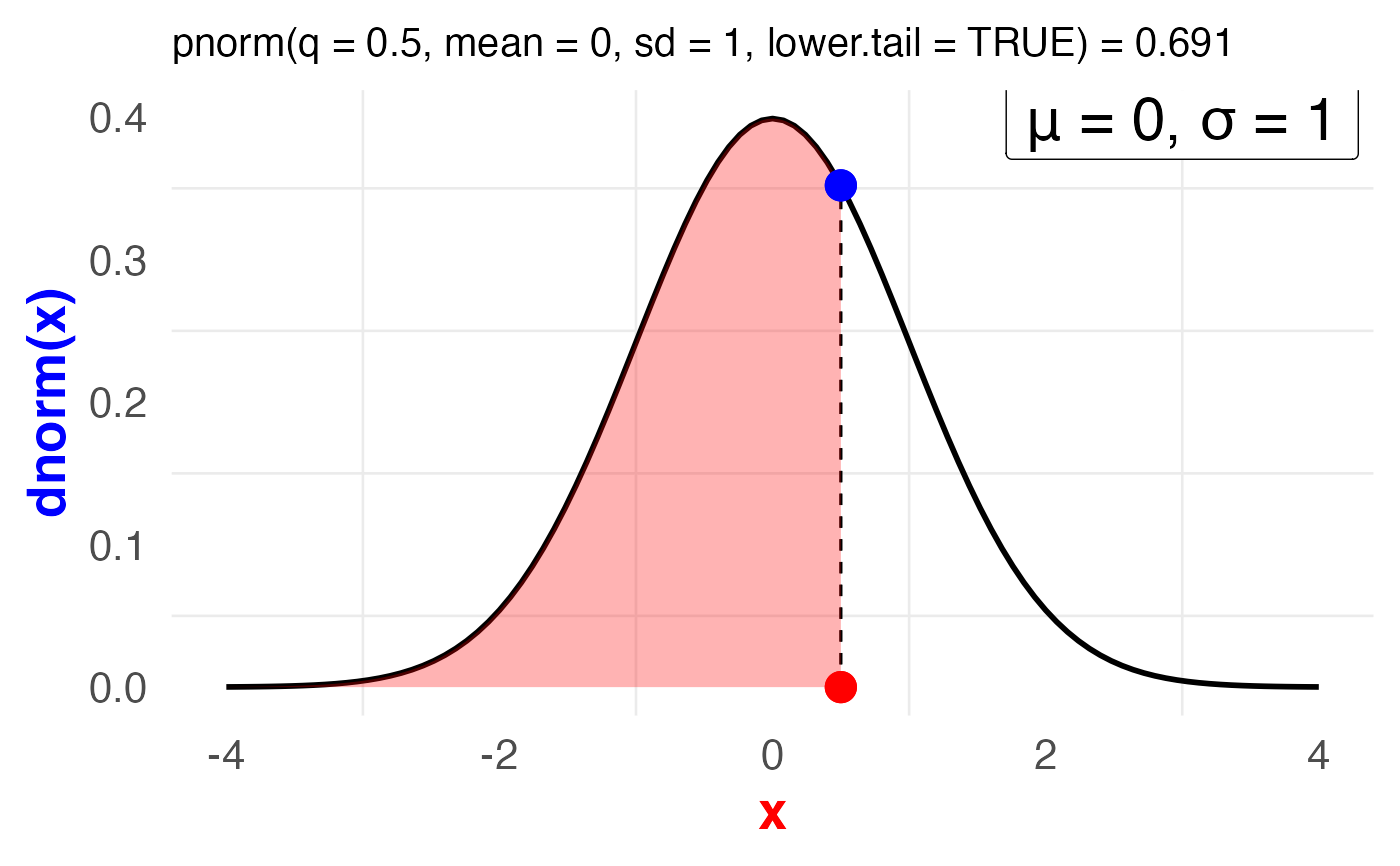
ggnorm(0.5, 0, 1, lower.tail = TRUE)
#> Warning: Using `size` aesthetic for lines was deprecated in ggplot2 3.4.0.
#> ℹ Please use `linewidth` instead.
#> ℹ The deprecated feature was likely used in the filor package.
#>   Please report the issue to the authors.