iris |>
    ggplot(
        aes(
            x = Sepal.Length,
            y = Petal.Width
        )
    ) +
    geom_point() +
coord_fixed(ratio = 1)Literate Programming
In a nutshell
Last modified: 2025-09-29
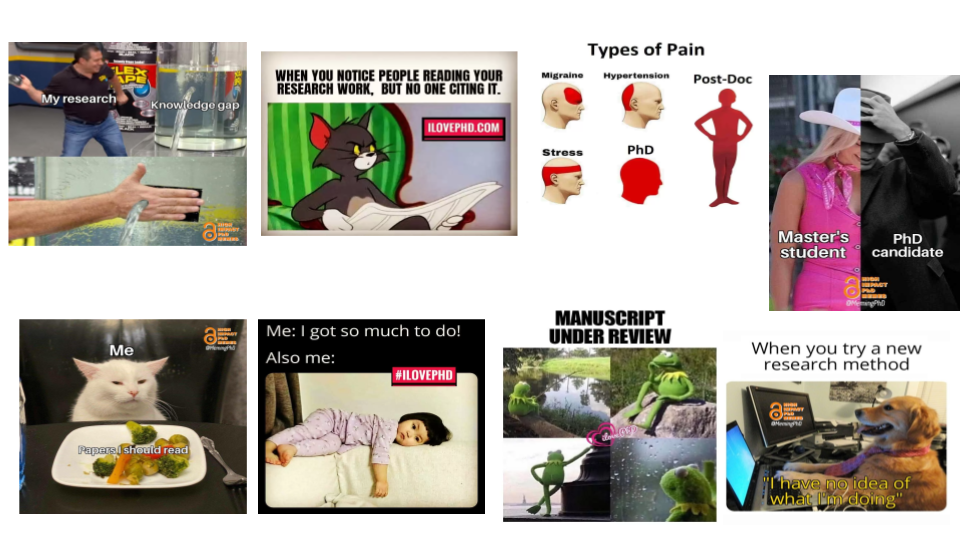
Doing research is hard…
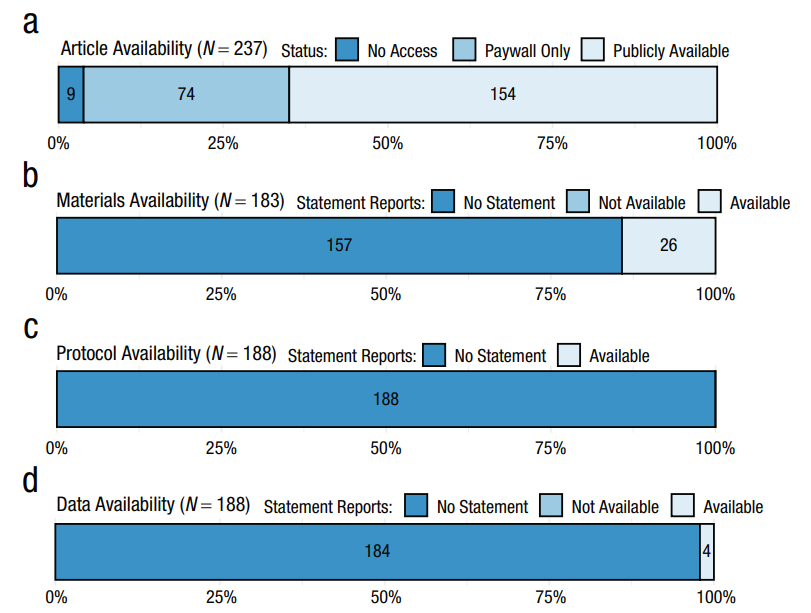
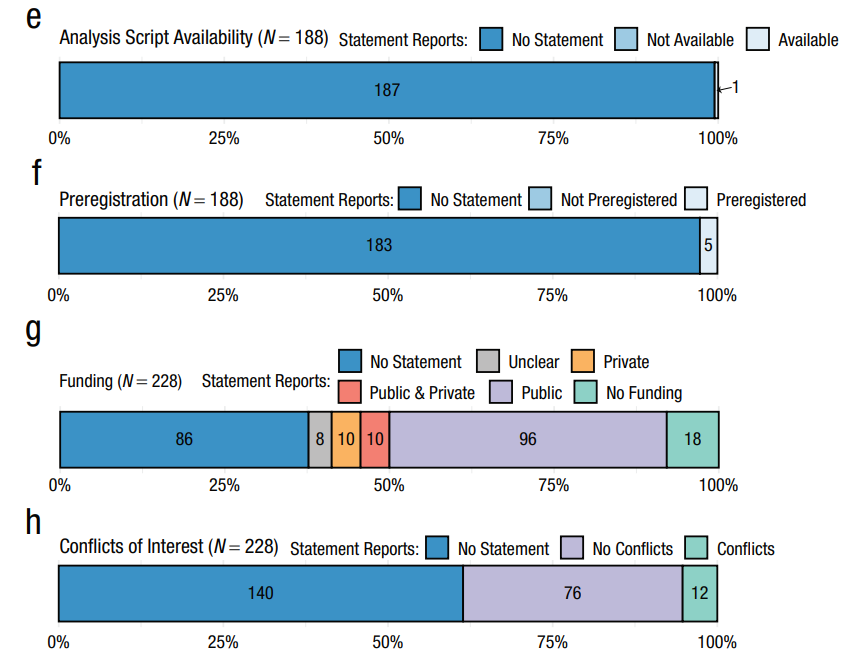
Is there an issue about reproducibility?
Hardwicke et al. (2022) estimated the open science practices in 250 psychology articles published between 2014 and 2017.
The big picture

The big picture

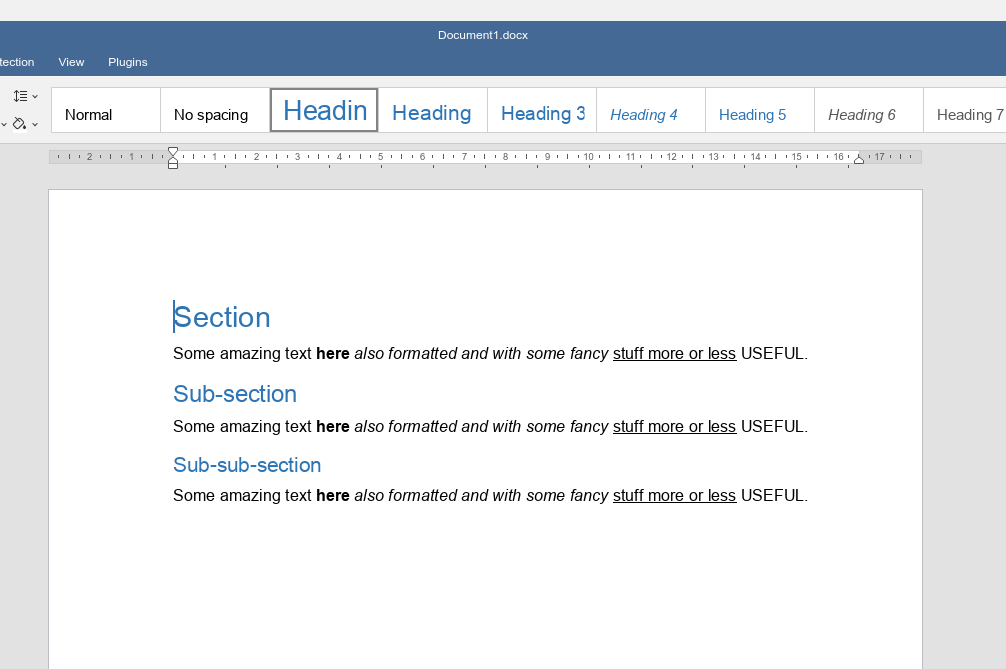
The 4 element in standard word processors
In Microsoft Word or Google Docs, the elements are usually combined in a uniform and coherent writing experience. You can write, add styling (bold, italic, etc.), add/remove images, create tables, etc.
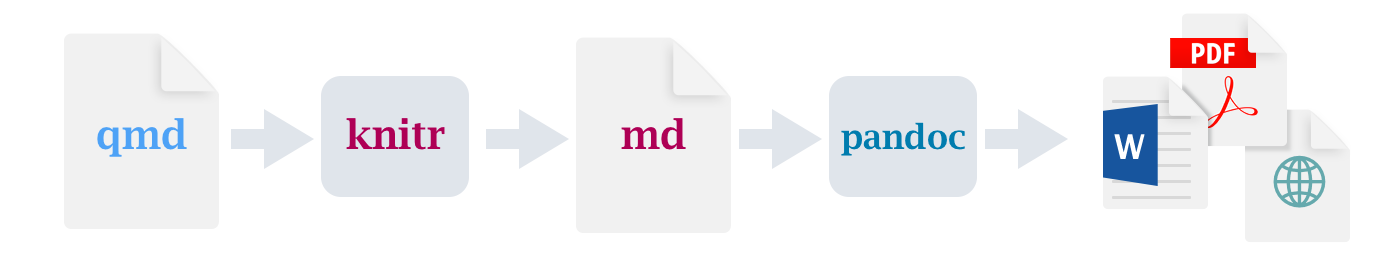
The real power of Markdown? conversion!
Basically, pandoc will take the .md file as a general input, convert the document into the plain-text target document (e.g., .tex or .html) and then compile the document creating the output.
Figures in Word/Google Docs
In standard WYSIWYG editors, the figures are external files embedded into the document. For updating the figure we need to re-create it externally and then re-importing into the document.
The essence of figures…
But in essence, if you use a programming language (e.g., MATLAB, Python or R), the figure is no longer the output file but some lines of code.

Literate programming, the big picture

Quarto, in a nutshell
The idea of Quarto is writing a unique *.qmd file. The file is compiled and using the knitr package (if using R) the R code is evaluated. The text is converted to the required format (e.g., latex if output is pdf) from markdown. The code output is included into the e.g. tex or html. Finally, the document is compiled into the output format.